Calculator methodology
The calculator combines published concentrations with the amounts and frequencies a person enters. It estimates exposure in studied categories—not particles retained in the body and not health risk.
The actual calculation
EmergingEach Monte Carlo run draws an amount and concentration for every eligible subtotal, evaluates that equation, and adds only compatible conventional-microplastic ingestion terms. The application runs 10,000 draws with a deterministic seeded random stream and reports the 5th, 50th and 95th percentiles.
Air uses a separate equation: 365 × indoor-time fraction × age-specific breathing volume × particles/m³. Polymer mass, nano-inclusive counts and food-contact release also stay in separate tracks.
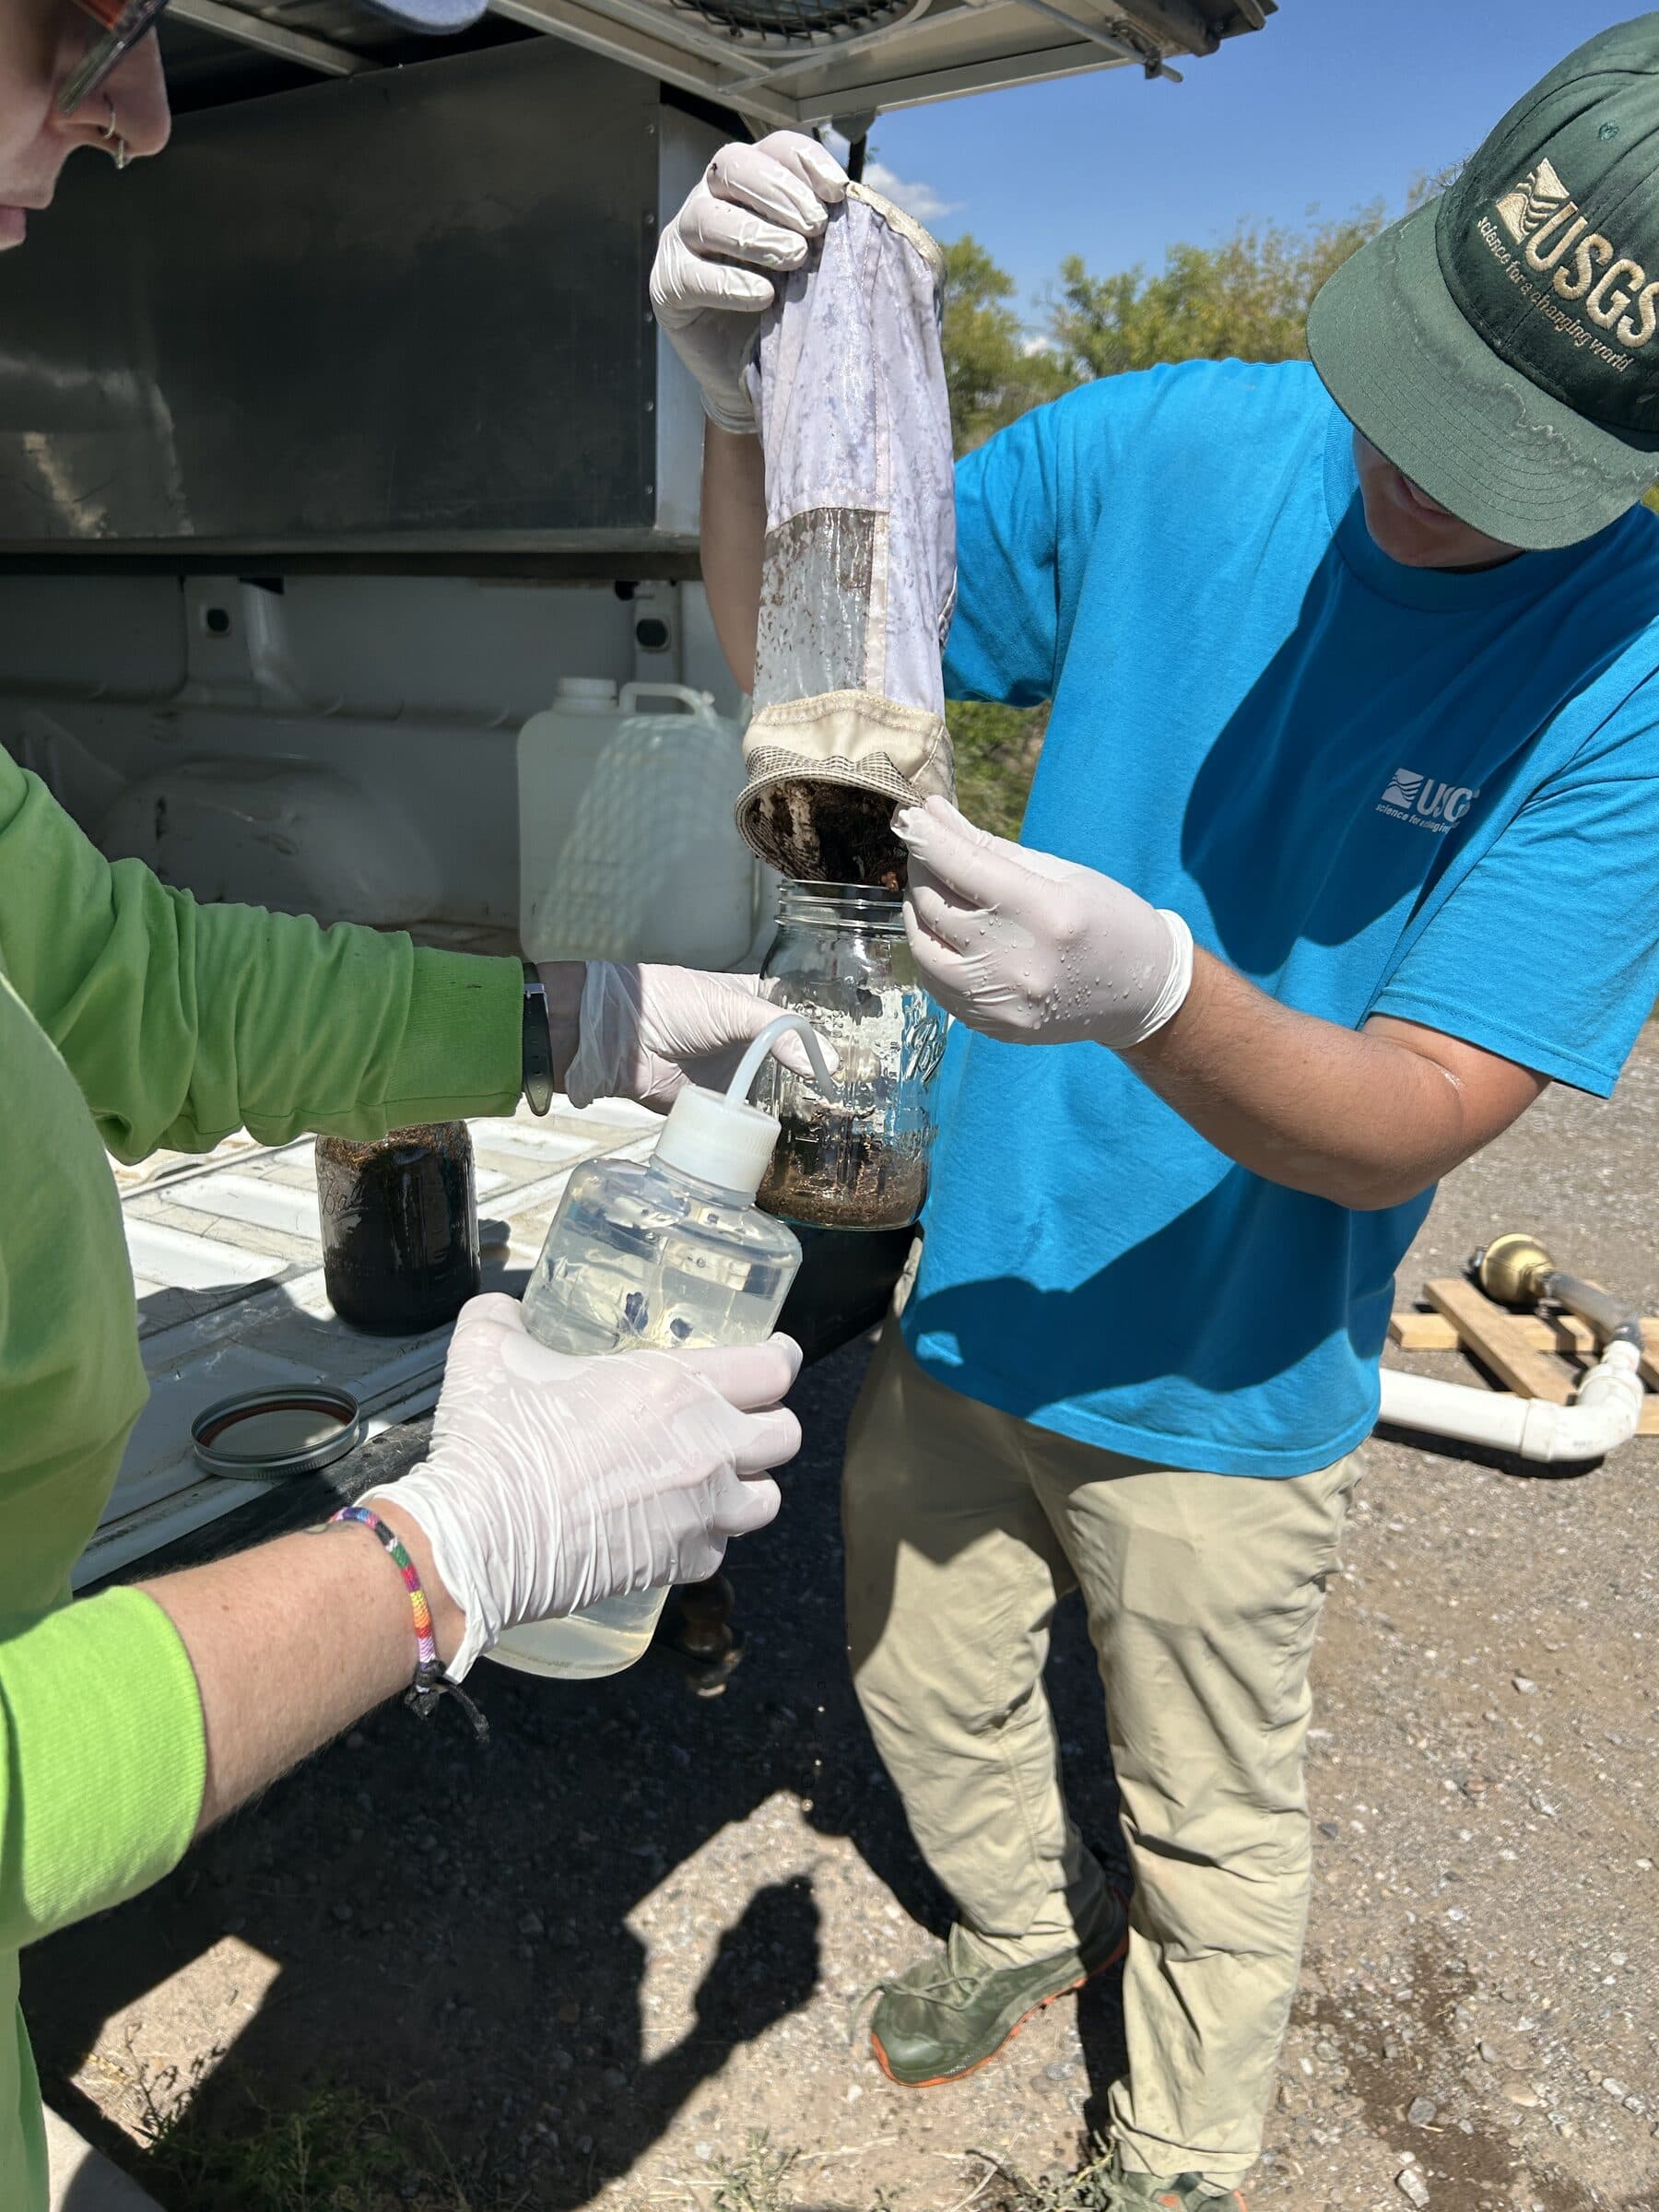
From water to a reported result
- 01Collect
- 02Control contamination
- 03Isolate
- 04Identify polymer
- 05Count or weigh
- 06Report uncertainty

Example coefficients in the model
| Coefficient | Published value | Source | Model treatment |
|---|---|---|---|
| C004 · bottled water | 325 particles/L | Mason, Welch & Neratko (2018) | Fixed in its sensitivity scenario; the paper supplies a mean but no spread in the normalized coefficient. |
| C005 · bottled water, nano-inclusive | 110,000 / 240,000 / 400,000 particles/L | Qian et al. (2024) | Triangular distribution from reported low, mean and high; shown outside the conventional-microplastic headline. |
| C006 · treated drinking water | 338–628 particles/L | Pivokonsky et al. (2018) | Uniform across the reported range because no central value is available. |
| C008 · single-use PET water | 2–44 particles/L | Schymanski et al. (2018) | Uniform across the reported range; 5–100 µm Raman method. |
| C015 · groundwater-derived water | 0–0.007 particles/L | Mintenig et al. (2019) | Uniform across the reported range; 20–500 µm FTIR method. |
These rows illustrate the water pathway. The results page lists every selected coefficient, study, geography, size range, method, equation inputs and distribution for that person’s run.
How a reported value becomes a distribution
- Low + central + high
- Triangular distribution anchored to all three reported values.
- Low + high
- Uniform distribution. This weaker shape assumption is disclosed in the result.
- One central value
- Held fixed. Between-study sensitivity carries the visible uncertainty instead of inventing a spread.
- Mean + standard deviation
- A positive lognormal is supported when both are available.
- Special case C086
- A right-skewed lognormal places the study median at P50 and its observed maximum at P95, following the workbook note.
What P5–P95 means—and does not mean
P5, P50 and P95 are percentiles of the calculator’s 10,000 simulated outputs for the answers supplied. They are not population rankings. The current site does not claim that a result is higher or lower than a percentage of real people, because no representative reference population with compatible measurements exists.
A separate study-choice sensitivity reruns the model with other eligible papers and reports the span of central estimates. It is displayed beside, never merged into, the within-scenario P5–P95 interval.
Geography and coverage
The selector prefers an exact-country study, then one from the country’s named region, then a global source. The result reports how many subtotals use each tier. Country changes study eligibility and the closest available consumption survey; it never multiplies exposure. A selection such as Chad therefore uses African or global proxies where no Chad study exists.
Limits carried into every result
- Published studies cover only part of food, drink and air exposure.
- Different size cutoffs and analytical methods produce incompatible counts.
- A modeled ingestion count is not absorbed dose, retained dose, body burden, or disease risk.
- Missing categories are research gaps, not zero exposure.