Science updates
Three recent studies that affect how this site explains measurement and exposure. Each entry separates the observation from the inference.
2026 · Smaller-particle drinking-water measurements
Emerging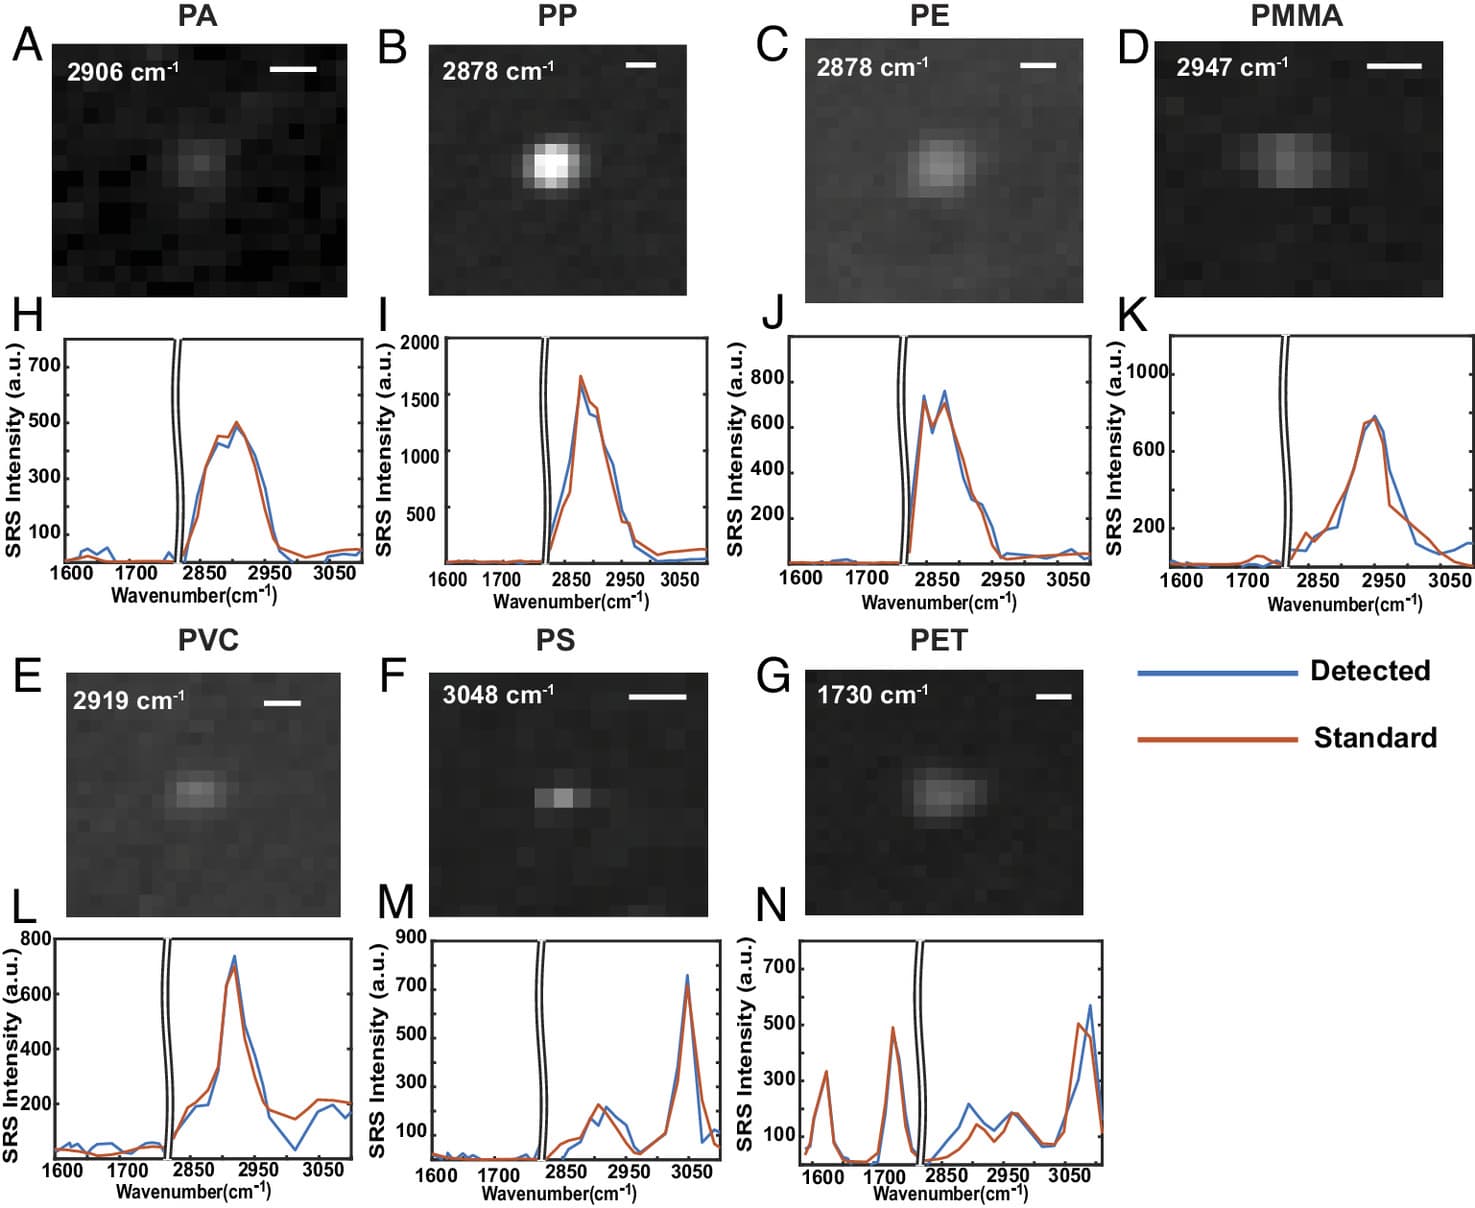
- What was studied
- Jamison Hart & Lenhart measured treated and bottled drinking water in the United States across a micro- and nano-range.
- What was found
- The study reported 1.6–2.6 million particles/L in treated water and 2.6–11.5 million particles/L in bottled water.
- What it cannot show
- Those counts cannot be added to or ranked against conventional studies with much larger detection thresholds, and they do not establish health effects.
- What changes here
- The calculator keeps these coefficients in a separate nano-inclusive track instead of using them in the headline conventional-microplastic estimate.
2025 · Microplastics across drinking-water treatment
Emerging- What was studied
- Balkenbusch et al. sampled source and finished water across ten U.S. drinking-water treatment facilities, targeting particles above 2 µm.
- What was found
- The study adds multi-facility evidence about where particles are retained or remain through treatment.
- What it cannot show
- Ten facilities are not a national concentration estimate, and treatment performance does not imply a personal dose or health outcome.
- What changes here
- It informs the explanation of treatment and geographic coverage; it is not reduced to one intake coefficient in the calculator.
2024 · Nanoplastics in bottled water
Emerging- What was studied
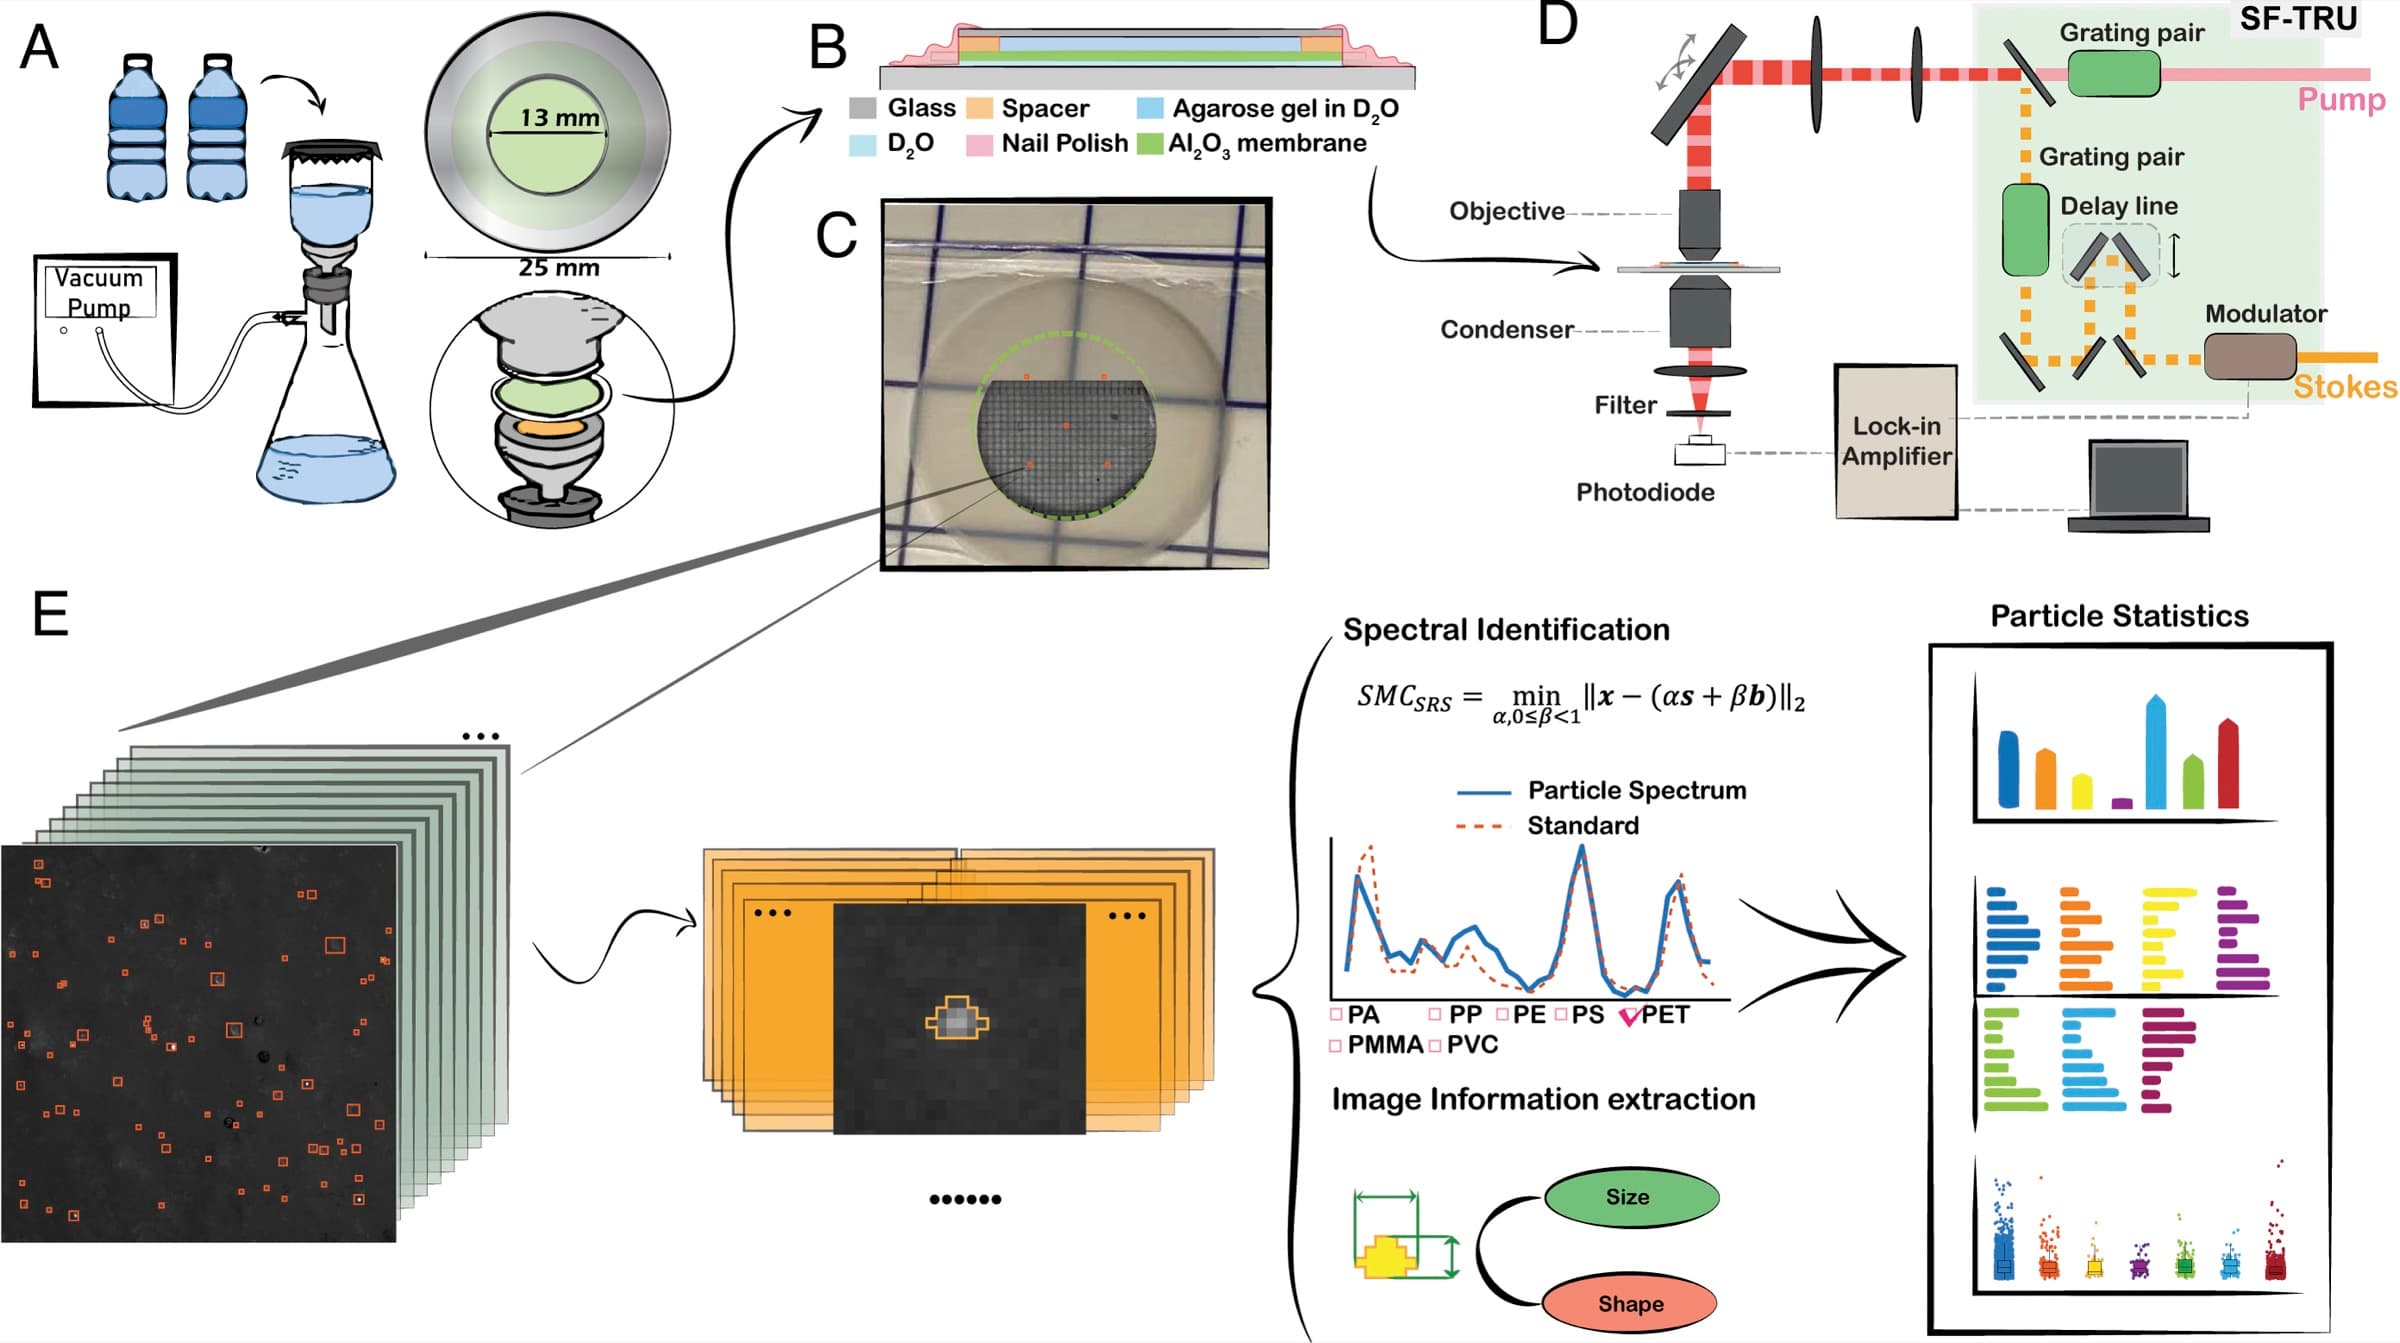
- Qian et al. used stimulated Raman scattering microscopy on bottled water, targeting particles approximately 0.1–5 µm.
- What was found
- The study reported a mean of about 240,000 particles/L, with 110,000–400,000 particles/L across samples.
- What it cannot show
- The small product sample does not represent every brand or country, and particle presence alone does not establish harm.
- What changes here
- The coefficient is modeled as a triangular 110,000 / 240,000 / 400,000 distribution and shown only in the nano-inclusive result.